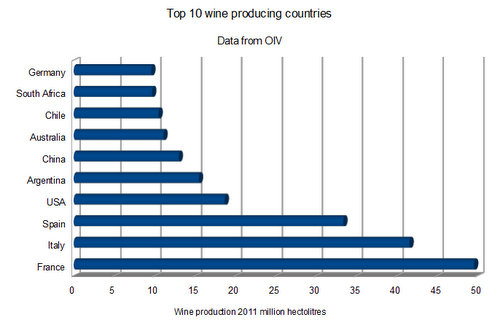
I like statistics. I found some on the OIV website today, so I popped them into a spreadsheet and produced some graphs. First of all, the top 10 wine producing countries. France, Italy and Spain are massive. No surprises there I guess.
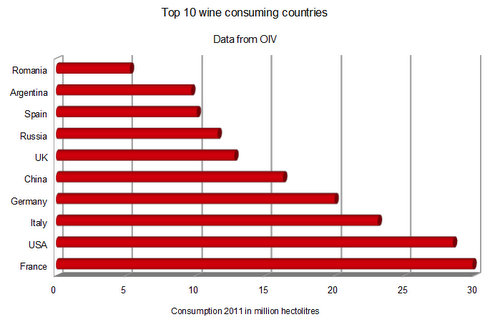
Next, the top 10 consuming countries. This shows how important the US is. Of all these countries, though, the UK probably imports the highest proportion, because it doesn’t make very much.
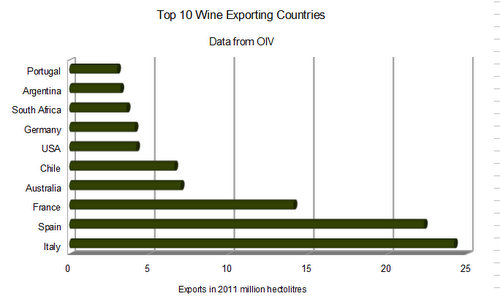
Finally, the top 10 exporting countries. Italy are the top wine exporting country in terms of volume, followed by Spain and France.
16 Comments on Time for some statistics


Good job, Jamie!
Pretty sure Germany is biggest importer of wine…. though there is a net against export in that a high % of exports from Germany have been imported first. This is because the wine has been shipped in bulk and then bottled there.
Is there comparable data from 5 years ago? – China growth must be pretty strong, but I was surprised to see just how much wine is now consumed in the US. In terms of value I imagine (2 buck-chuck aside) the US must be the biggest market.
Is that big chinese export figure down to bottling then redistributing aropund Asia? If not, then who’s drinking all that wine from China?
Most studies I have seen report that the U.S. is currently the largest wine-consuming nation, measured by volume and value.
China will be huge until India hits the world stats, but on a weighted basis based on population both will be small in consumption compared to European counties and the USA.
It’s odd Chile is in the top volume producers but not exporters, they only have 16M in country so they should be top consumers on a weighted scale 😉
One has to LOVE the STATS!!!! Bars are gooood : )
“Lies, damned lies, and statistics”… don’t forget quality, not just volume!
Lee, it is quite odd, because it should be…. there instead of China. China is a very large producer (more than Australia), but does not export wine…..yet
Jamie,
The figure for China has to be incorrect. China’s wine exports are still very small. I couldn’t find your figure on the OIV website.
BTW the OIV is a good source for global data. Patrick Aigrain and his colleagues put a lot of work into reconciling some pretty disparate data sets.
Is the China export number reflecting wine arriving in Hong Kong and then moving to Mainland? Or is it wine being exported to Africa? Where else can it go to?
Or just a mistake with the labelling – it is “Chile” not “China”!!!
Hmm, Romania (population 21 million or so) imports half the wine of the UK (population nearly 60 million). Romania makes wine, and is nowhere near as rich as the UK. Something odd here….
I have checked. The China figure for exports is wrong. What a difference two letters make: should be Chile. That now makes sense, and I’ve changed the graph accordingly!
I think much of Romania’s wine consumption is based on autoconsumption (wine made and consumed in small rural households).
Afterall the vineyards in Romania are heavily fragmented, with many small plots owned by rural households and planted with hibrids.
I’m amused to see the confusion between consumption and imports. These figures cover production, consumption and exports. They do not have anything to do with imports. Hence the queries over Romania, Germany, China etc. Import and export figures have to be viewed with suspicion in any case, given the way wine is now often bottles in countries between production and consumption – and the relaxed way in which some S American imports sometimes change nationality once they hit European waters.
Would be good to see consumption per capita rather than per country to better indicate indicate it’s real consumption. It’ll probably show the wealthier countries are the largest consumers but also that nations like America with large populations are relatively lower consumers.
Robert, I think the comments about imports were looking at consumption, and then figuring out how much of that consumption was of domestic production versus imports, so not necessarily a confusion.